Most of the corejoomla applications uses Ajax requests to send and recieve information from the server. Ajax is a technique used to send/recieve data from the server asynchronously (without reloading page). You can find more about Ajax at this page:
https://en.wikipedia.org/wiki/Ajax_(programming)
We use json requests to send and receive data with Ajax. When the result sent from the server is proper json formatted text, JavaScript can process it and show corresponding output. However at times the server may add unexpected outout to the response either because of some unexpected error or because of third party plugins. In this case JavaScript fails and do not show any response to the user causing the request to wait infinitely. To debug such issues follow the below steps.
- Enable the “Error Reporting” option in Global Configuration to Simple/Maximum/Development
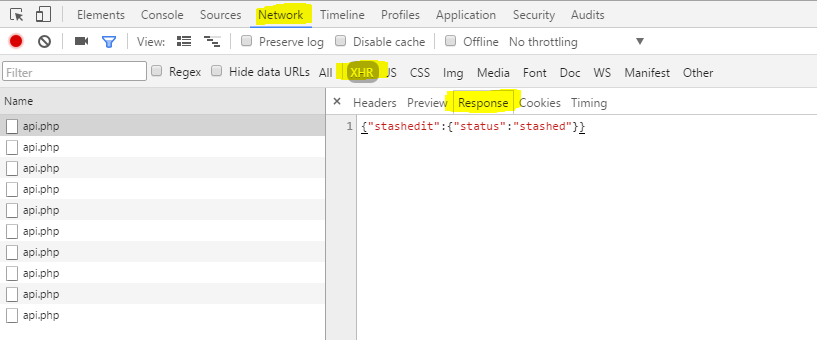
- Open the Chrome browser and enable developer tools by pressing F12. This will show the developer tools console.
- Click on Network tab and filter only XHR requests
- Now access the corresponding front-end page and follow the steps which produced ajax request being failed. For example, clicking a submit button on the survey page.
- You should see the ajax request is being created in the developer console, click on it.
- Now you can see the details in different tabs. Click on Response tab
- Note down the output shown and report it to us.
